Group Comparison and Correlation
11 ตุลาคม 2566 - เวลาอ่าน 3 นาที
It’s the same thing in statistics but different in questions.
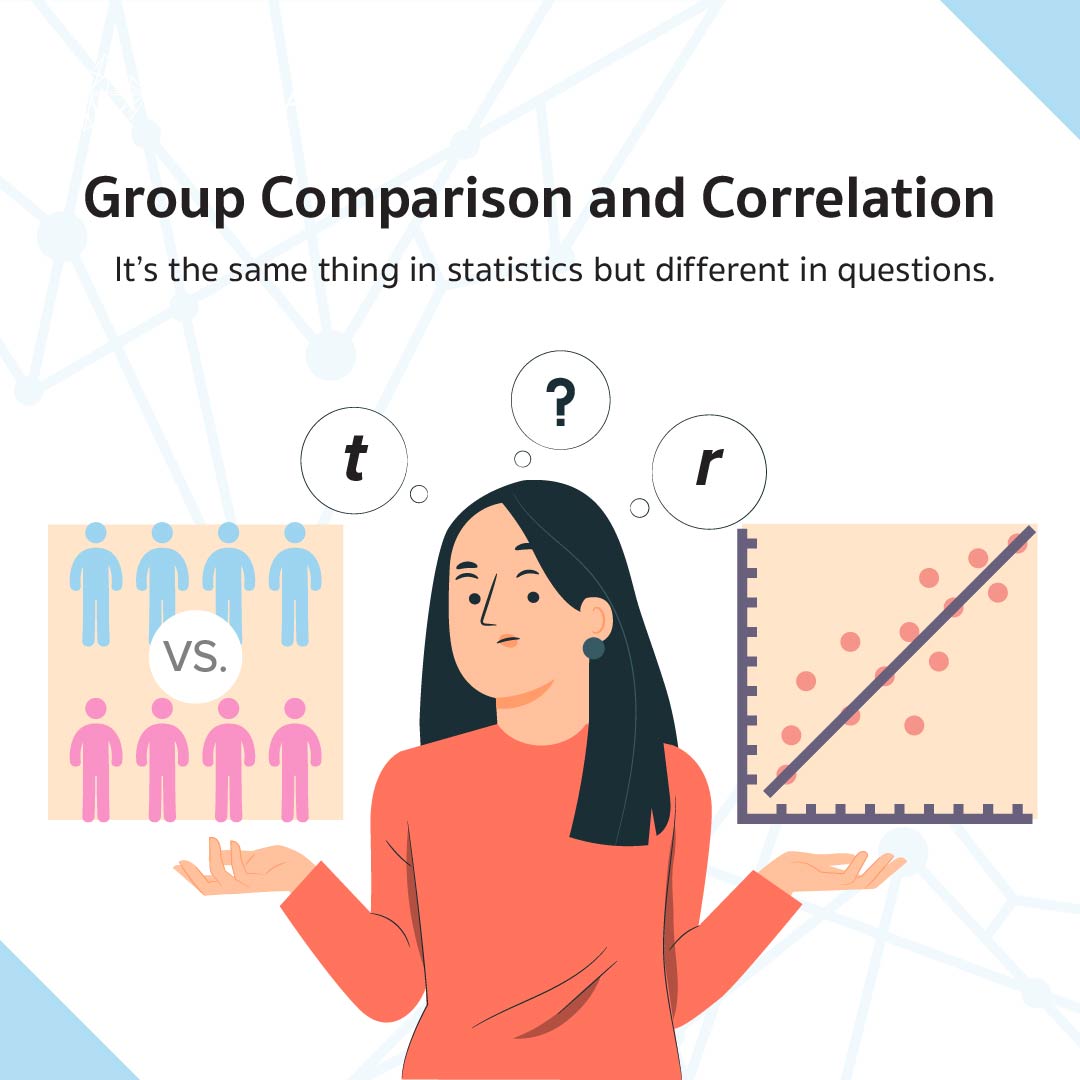
People who have studied statistics may recall that when testing differences between groups, for example, testing the difference in height between males and females, statistical tests such as t-tests are used. When there are more than two conditions, such as testing the difference between single and married males and females, analysis of variance (ANOVA) is employed.
On the other hand, examining the relationship between two variables, whether they move in the same direction, opposite directions, or have no relationship, is done using correlation. Typically, correlation is applied to continuous variables, which means variables that can take on a range of values, such as the relationship between height and weight.
Generally, if you have one variable that is categorical (grouped), like gender, and another variable that is continuous, like height, people may think there is no relationship between these two variables. They might assume that you should use a method to test for differences between groups. However, statistically speaking, you can indeed find a relationship between these two variables.
Statistically, "relationship" means that when one variable changes, the other variable changes as well. For example, if height increases, there is a tendency for weight to increase. This means that gender and height can also have a relationship.
In cases where one variable is categorical, you can still define relationships. For example, when changing from female to male, height tends to increase. In this case, gender is related to height. Moreover, both variables can be categorical. For example, the province of birth can be related to music preferences; people born in the northeastern region might prefer folk music more than people born in the southern region.
Therefore, differentiating between testing differences between groups and testing relationships is essentially a way of communicating the concepts to make them more easily understood. Looking more deeply into statistics, these two ideas are essentially the same.
For example, when examining the relationship between a categorical variable and a continuous variable, statistical tests are performed, such as the point-biserial correlation, which has values ranging from -1 to 1, similar to regular correlation.
What's added when testing differences between groups is the examination of whether the relationship is significantly different from zero. In such cases, independent t-tests are used, similar to testing for differences, but to assess the magnitude of the difference, Cohen's d is used to see how much of a standard deviation the difference is.
For individuals who need to use statistics in research, whether they are university students or researchers, there might be questions about when to interpret a problem in terms of a relationship and when to interpret it in terms of a difference. The decision depends on the research question. If researchers want to investigate which variable is more related to the outcome variable, or if they need to create a correlation matrix for advanced statistical analysis, interpreting it in terms of a relationship is appropriate. However, if the research question involves comparisons, interpreting it in terms of analyzing differences is more suitable.
Nonetheless, the fundamental principles of statistics underpin both approaches, and it's largely a matter of perspective.


